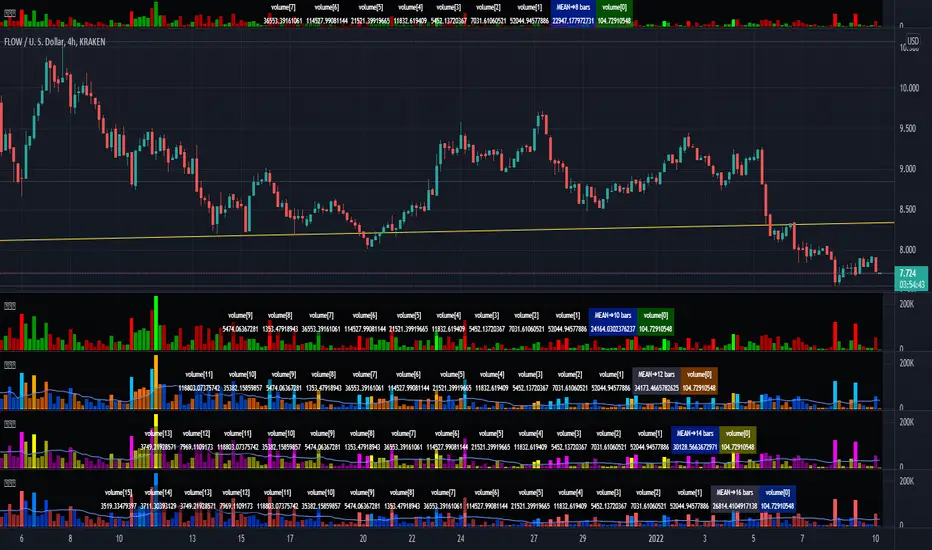
Enhanced Volume MonitorThis is my enhanced volume monitor using Pine Script version 4.0 freely available to ALL! It's very much like the built-in TV volume monitor displayed in the overlay chart, but it isn't dockable like TV's, sorry. Maybe one day they will find it in thier hearts to adopt this script for thier built-in replacement. I would gladly do so and already offered it previously. I preferably put it over top of the overlay chart by itself, just like you see above, and then I can expand it down easily for a substantially better quick inspection. I provided a wide assortment of vibrant color schemes to choose from for anyone who may have vision impairments. This also displays that color scheming is VERY possible in Pine.
I would personally like to thank the talented individuals at TV for providing a platform that embraces an initial free membership, which I first obtained myself, for individuals like me to freely code in Pine with mathemagical ideas and mental wizardry, creating ultimately, inventions like this eye candy display above.
Features List Includes:
I.P.O.C.S.(Initial Public Offering Clean Start) Technology - plotting from day one, minute one of IPO with all 4 moving averages
Enable/disable dark background for enhanced visibility
Color schemes (all displayed above)
Enable/disable tricolor scheme
Enable/disable volume moving average
Moving average "type" option with multiple selections
Adjustable moving average period
If you do have any questions or comments regarding this indicator, I will consider your inquiries, thoughts, and ideas presented below in the comments section, when time provides it. As always, "Like" it if you simply just like it, and also return to my scripts list occasionally for additional postings. Have a profitable future everyone!
Search in scripts for "COLORED VOLUME"
Cnagda Pure Price ActionCnagda Pure Price Action (CPPA) indicator is a pure price action-based system designed to provide traders with real-time, dynamic analysis of the market. It automatically identifies key candles, support and resistance zones, and potential buy/sell signals by combining price, volume, and multiple popular trend indicators.
How Price Action & Volume Analysis Works
Silver Zone – Logic, Reason, and Trade Planning
Logic & Visualization:
The Silver Zone is created when the closing price is the lowest in the chosen window and volume is the highest in that window.
Visually, a large silver-colored box/rectangle appears on the chart.
Thick horizontal lines (top and bottom) are drawn at the high and low of that candle/bar, extending to the right.
Reasoning:
This combination typically occurs at strong “accumulation” or support areas:
Sellers push the price down to the lowest point, but aggressive buyers step in with high volume, absorbing supply.
Indicates potential exhaustion of selling and likely shift in market control to buyers.
How to Plan Trades Using Silver Zone:
Watch if price returns to the Silver Zone in the future: It often acts as powerful support.
Bullish entries (buys) can be planned when price tests or slightly pierces this zone, especially if new buy signals occur (like yellow/green candle labels).
Place your stop-loss below the bottom line of the Silver Zone.
Target: Look for the nearest resistance or opposing zone, or use indicator’s bullish label as confirmation.
Extra Tip:
Multiple touches of the Silver Zone reinforce its importance, but if price closes deeply below it with high volume, that’s a caution signal—support may be breaking.
Black Zone – Logic, Reason, and Trade Planning (as CPPA):
Logic & Visualization:
The Black Zone is created when the closing price is the highest in the chosen window and volume is the lowest in that window.
Visually, a large black-colored box/rectangle appears on the chart, along with thick horizontal lines at the top (high) and bottom (low) of the candle, extending to the right.
Reasoning:
This combination signals a strong “distribution” or resistance area:
Buyers push the price up to a local high, but low volume means there is not much follow-through or conviction in the move.
Often marks exhaustion where uptrend may pause or reverse, as sellers can soon step in.
How to Plan Trades Using Black Zone:
If price revisits the Black Zone in the future, it often acts as major resistance.
Bearish entries (sells) are considered when price is near, testing, or slightly above the Black Zone—especially if new sell signals appear (like blue/red candle labels).
Place your stop-loss just above the top line of the Black Zone.
Target: Nearest support zone (such as a Silver Zone) or next indicator’s bearish label.
Extra Tip:
Multiple touches of the Black Zone make it stronger, but if price closes far above with rising volume, be cautious—resistance might be breaking.
Support Line – Logic, Reason, and Trade Planning (as Cppa):
Logic & Visualization:
The Support Line is a dynamically drawn dashed line (usually blue) that marks key price levels where the market has previously shown significant buying interest.
The line is generated whenever a candle forms a high price with high volume (orange logic).
The script checks for historical pivot lows, past support zones, and even higher timeframe (HTF) supports, and then extends a blue dashed line from that price level to the right, labeling it (sometimes as “Prev Support Orange, HTF”).
Reasoning:
This line helps you visually identify where demand has been strong enough to hold price from falling further—essentially a floor in the market used by professional traders.
If price approaches or re-tests this line, there’s a good chance buyers will defend it again.
How to Plan Trades Using Support Line:
Watch for price to approach the Support Line during down moves. If you see a bullish candlestick pattern, buy labels (yellow/green), or other indicators aligning, this can be a high-probability entry zone.
Great for planning stop-loss for long trades: place stops just below this line.
Target: Next resistance zone, Black Zone, or the top of the last swing.
Extra Tip:
Multiple confirmations (support line + Silver Zone + bullish label) provide powerful entry signals.
If price closes strongly below the Support Line with volume, be cautious—support may be breaking, and a trend reversal or deeper correction could follow.
Resistance Line – Logic, Reason, and Trade Planning (from CPPA):
Logic & Visualization:
The Resistance Line is a dynamically drawn dashed line (usually purple or red) that identifies price levels where the market has previously faced significant selling pressure.
This line is created when a candle reaches a high price combined with high volume (orange logic), or from a historical pivot high/resistance,
The script also tracks higher timeframe (HTF) resistance lines, labeled as “Prev Resistance Orange, HTF,” and extends these dashed lines to the right across the chart.
Reasoning:
Resistance Lines are visual markers of “supply zones,” where buyers previously failed, and sellers took control.
If the price returns to this line later, sellers may get active again to defend this level, halting the uptrend.
How to Plan Trades Using Resistance Line:
Watch for price to approach the Resistance Line during up moves. If you see bearish candlestick patterns, sell labels (blue/red), or bearish indicator confirmation, this becomes a strong shorting opportunity.
Perfect for placing stop-loss in short trades—put your stop just above the Resistance Line.
Target: Next support zone (Silver Zone) or bottom of the last swing.
If the price breaks above with high volume, avoid shorting—resistance may be failing.
Extra Tip:
Multiple resistances (Resistance Line + Black Zone + bearish label) make short signals stronger.
Choppy movement around this line often signals indecision; wait for a clear rejection before entering trades.
Bullish / Bearish Label – Logic, Reason, and Trade Planning:
Logic & Visualization:
The indicator constantly calculates a "Bull Score" and a "Bear Score" based on several factors:
Trend direction from price slope
Confirmation by popular indicators (RSI, ADX, SAR, CMF, OBV, CCI, Bollinger Bands, TWAP)
Adaptive scoring (higher score for each bullish/bearish condition met)
If Bull Score > Bear Score, the chart displays a green "BULLISH" label (usually below the bar).
If Bear Score > Bull Score, the chart displays a red "BEARISH" label (usually above the bar).
If neither dominates, a "NEUTRAL" label appears.
Reasoning:
The labels summarize complex price action and indicator analysis into a simple, actionable sentiment cue:
Bullish: Majority of conditions indicate buying strength; trend is up.
Bearish: Majority signals show selling pressure; trend is down.
How to Use in Trade Planning:
Use the Bullish label as confirmation to enter or hold long (buy) positions, especially if near support/Silver Zone.
Use the Bearish label to enter/hold short (sell) positions, especially if near resistance/Black Zone.
For best results, combine with candle color, volume analysis, or other labels (yellow/green for buys, blue/red for sells).
Avoid trading against these labels unless you have strong confluence from zones/support levels.
Yellow Label (Buy Signal) – Logic, Reason & Trade Planning:
Logic & Visualization:
The yellow label appears below a candle (label.style_label_up, yloc.belowbar) and marks a potential buy signal.
Script conditions:
The candle must be a “yellow candle” (which means it’s at the local lowest close, not a high, with normal volume).
Volume is decreasing for 2 consecutive candles (current volume < previous volume, previous volume < second previous).
When these conditions are met, a yellow label is plotted below the candle.
Reasoning:
This scenario often marks the end of selling pressure and start of possible accumulation—buyers may be stepping in as sellers exhaust.
Decreasing volume during a local price low means selling is slowing, possibly hinting at a reversal.
How to Trade Using Yellow Label:
Entry: Consider buying at/just above the yellow-labeled candle’s close.
Stop-loss: A bit below the candle’s low (or Silver Zone line, if present).
Target: Next resistance level, Black Zone, or chart’s bullish label.
Extra Tip:
If the yellow label is found at/near a Silver Zone or Support Line, and trend is “Bullish,” the setup gets even stronger.
Avoid trading if overall indicator shows “Bearish.”
Green Label (Buy with Increasing Volume) – Logic, Reason & Trade Planning:
Logic & Visualization:
The green label is plotted below a candle (label.style_label_up, yloc.belowbar) and marks a strong buy signal.
Script conditions:
The candle must be a “yellow candle” (at the local lowest close, normal volume).
Volume is increasing for 2 consecutive candles (current volume > previous volume, previous volume > second previous).
When these conditions are met, a green label is plotted below the candle.
Reasoning:
This scenario signals that buyers are stepping in aggressively at a local price low—the end of a downtrend with strong, rising activity.
Increasing volume at a price low is a classic sign of accumulation, where institutions or large players may be buying.
How to Trade Using Green Label:
Entry: Consider buying at/just above the green-labeled candle’s close for a momentum-based reversal.
Stop-loss: Slightly below the candle’s low, or the Silver Zone/support line if present.
Target: Nearest resistance zone/Black Zone, indicator’s bullish label, or next swing high.
Extra Tip:
If the green label is near other supports (Silver Zone, Support Line), the setup is extra strong.
Use confirmation from Bullish labels or trend signals for best results.
Green label setups are suitable for quick, high momentum trades due to increasing volume
Blue Label (Sell Signal on Decreasing Volume) – Logic, Reason & Trade Planning:
Logic & Visualization:
The blue label is plotted above a candle (label.style_label_down, yloc.abovebar) as a potential sell signal.
Script conditions:
The candle is a “blue candle” (local highest close, but not also lowest, and volume is neither highest nor lowest).
Volume is decreasing over 2 consecutive candles (current volume < previous, previous < two ago).
When these match, a blue label appears above the candle.
Reasoning:
This typically signals buyer exhaustion at a local high: price has gone up, but volume is dropping, suggesting big players may not be buying any more at these levels.
The trend is losing strength, and a reversal or pullback is likely.
How to Trade Using Blue Label:
Entry: Look to sell at/just below the candle with the blue label.
Stop-loss: Just above the candle’s high (or above the Black Zone/resistance if present).
Target: Nearest support, Silver Zone, or a swing low.
Extra Tip:
Blue label signals are stronger if they appear near Black Zones or Resistance Lines, or when the general market label is "Bearish."
As with buy setups, always check for confirmation from trend or volume before trading aggressively.
Here’s a summary of all key chart labels, zones, and trading logic of your Price Action script:
Silver Zone: Powerful support zone. Created at lowest close + highest volume. Best for buy entries near its lines.
Black Zone: Strong resistance zone. Created at highest close + lowest volume. Ideal for short trades near its levels.
Support Line: Blue dashed line at historical demand; buyers defend here. Look for bullish setups when price approaches.
Resistance Line: Purple/red dashed line at supply; sellers defend here. Great for bearish setups when price nears.
Bullish/Bearish Labels: Summarize trend direction using price action + multiple indicator confirmations. Plan buys, holds on bullish; sells, shorts on bearish.
Yellow Label: Buy signal on decreasing volume and local price low. Entry above candle, stop below, target next resistance.
Green Label: Strong buy on increasing volume at a price low. Entry for momentum trade, stop below, target next zone.
Blue Label: Sell signal on dropping volume and local price high. Entry below candle, stop above, target next support.
Best Practices:
Always combine zone/label signals for higher probability trades.
Use stop-loss near zones/lines for risk management.
Prefer trading in the trend direction (bullish/bearish label agrees with your entry).
if Any Question, Suggestion Feel free to ask
Disclaimer:
All information provided by this indicator is for educational and analysis purposes only, and should not be considered financial advice.

Student Wyckoff volume background levels
**STUDENT WYCKOFF Volume Background Levels**
This indicator colors volume bars according to how large or small the current volume is relative to the recent background. Instead of looking at “raw” volume, it shows whether today’s activity is *extreme, high, normal, low or ultra-low* compared to what is usual for this market and timeframe.
### Concept
* The script calculates a **background average volume** over a user-defined number of bars (background window).
* For each bar it computes the ratio:
> `Volume Ratio = Current Volume / Average Volume`
* Depending on how big this ratio is, the volume bar is assigned to one of five categories and colored accordingly.
This makes it very easy to see where real effort (unusual activity) appears and where the market is quiet.
### Color scheme and thresholds (default)
All thresholds are defined as a multiple of the average volume:
* **Extreme volume** – **purple**
`volume ≥ Extreme * average` (default 3.0×)
Very rare, climactic activity. Often associated with buying/selling climaxes, stopping volume or very aggressive participation.
* **High volume** – **light red**
`volume ≥ High * average` (default 1.5×)
Clearly above-average volume. Important bars in trends or near key support/resistance.
* **Normal volume** – **gray**
Around the background average. Regular market activity.
* **Low volume** – **light yellow**
`volume ≤ Low * average` (default 0.7×)
Below-average activity. In Wyckoff/VSA context this can support ideas like No Demand / No Supply (together with spread and result).
* **Ultra-low volume** – **bright green**
`volume ≤ Ultra Low * average` (default 0.3×)
Very quiet market. Often marks zones of complete disinterest, late phases of trends, or calm periods before new campaigns.
All multipliers and colors are user-adjustable.
### How to use it
This is **not a standalone buy/sell signal**, but a visual tool to support Wyckoff/VSA reading:
* Highlight **climactic or stopping bars** by looking for purple (extreme) and light-red (high) volume around important price levels.
* Confirm **No Demand / No Supply** ideas by checking for low or ultra-low volume while price is drifting.
* Study how volume background changes between phases of a trading range, mark-up and mark-down.
The indicator works on any symbol and timeframe, uses only closed bars (no repainting) and is intended for educational and analytical purposes. Always combine it with your own price action reading, risk management and trading plan.

Volume Pulse [ziksfx]Volume Pulse is a clean volume indicator designed to make it easier to read meaningful changes in activity without cluttering your chart. It enhances the standard volume view by supporting both classic volume and dollar volume , highlighting spikes and extreme bars and adding a compact label on the latest bar so you always see the current volume value at a glance. The script is intended to be used in a separate volume pane.
How it works
– Supports two modes: standard volume or dollar volume (close × volume).
– Colors volume bars by candle direction (up/down). Optionally, it can:
• highlight volume spikes above a moving average;
• mark the highest-volume bar over a user-defined lookback period.
– Plots a simple moving average of volume so you can quickly see when activity is above or below typical levels.
– On the latest bar, shows a small label with the current volume value, automatically abbreviated (K / M / B) and optionally prefixed with “$” in dollar-volume mode.
Inputs & customization
– Volume type: choose between standard volume and dollar volume.
– Volume MA length: controls how sensitive the moving average is to recent changes in activity.
– Spike highlighting: optional, turns on/off coloring for bars where volume exceeds the moving average.
– Highest-volume bar lookback: sets the period for detecting the highest-volume bar.
– Label position: choose whether the last-bar label appears on the left or right side of the bar, and optionally shift it slightly above the bar for better readability.
Use cases
Use Volume Pulse to:
– Spot sudden spikes in volume and compare them to the recent average.
– Identify sessions or candles with unusually high activity relative to a chosen TF.
– Visually study how volume behaves around price moves, breakouts or potential fakeouts to better understand their strength or weakness.
– Keep track of the latest bar’s volume instantly, without having to read the raw scale values.
This indicator works on any symbol that has volume data (stocks, futures, crypto and more), but volume quality may vary between markets and instruments. It is intended as an analytical and educational tool only: it does not constitute financial advice and does not provide or guarantee any trading results. Always combine volume context with your own analysis and risk management.

Volumes on CandleThis script uses standard deviation of volume from the mean to color the candles.
IMPORTANT: Hide original candle, clicking in the "eye" near title.
I prefer use large Length input for more stability at mean and standard deviation values.
Uses 5 colors, by default:
Red = Volume >= 4 stdev;
Orange = 4 stdev > Volume >= 2.5 stdev;
Yellow = 2.5 stdev > Volume >= 1 stdev;
White = 1 stdev > Volume >= -0.5 stdev;
Aqua = -0.5 stdev > Volume.
I coded another script, called "Colored Volumes Histogram". It uses the same idea, but color directly the volume histogram.

Low Volatility Breakout Detector)This indicator is designed to visually identify potential breakouts from consolidation during periods of low volatility. It is based on classic Bollinger Bands and relative volume. Its primary purpose is not to generate buy or sell signals but to assist in spotting moments when the market exits a stagnation phase.
Arrows appear only when the price breaks above the upper or below the lower Bollinger Band, the band width is below a specified threshold (expressed in percentage), and volume is above its moving average multiplied by a chosen multiplier (default is 1). This combination may indicate the start of a new impulse following a period of low activity.
The chart background during low volatility is colored based on volume strength—the lower the volume during stagnation, the less transparent the background. This helps quickly spot unusual market behavior under seemingly calm conditions. The background opacity is dynamically scaled relative to the range of volumes over a selected period, which can be set manually (default is 50 bars).
The indicator works best in classic horizontal consolidations, where price moves within a narrow range and volatility and volume clearly decline. It is not intended to detect breakouts from formations such as triangles or wedges, which may not always exhibit low volatility relative to Bollinger Bands.
Settings allow you to adjust:
Bollinger Band length and multiplier,
Volatility threshold (in %),
Background and arrow colors,
Volume moving average length and multiplier,
Bar range used for background opacity scaling.
Note: For reliable results, it’s advisable to tailor the volatility threshold and volume/background ranges to the specific market and timeframe, as different instruments have distinct dynamics. If you want the background color to closely match the color of breakout arrows, you should set the same volume analysis period as the volume moving average length.
Additional note: To achieve a cleaner chart and focus solely on breakout signals, you can disable the background and Bollinger Bands display in the settings. This will leave only the breakout arrows visible on the chart, providing a clearer and more readable market picture.

Volume Matrix Pro [ChartNation]Volume Matrix Pro is a comprehensive volume profile indicator that combines delta-colored volume distribution analysis with adaptive pivot detection and automated volume node identification. The indicator visualizes where institutional volume accumulated at specific price levels, providing traders with precise entry zones backed by actual trading data.
KEY FEATURES:
Delta-Colored Volume Profile: Displays volume distribution across price bins with automatic delta coloring - green bins show buyer dominance, red bins show seller control at each price level
High Volume Nodes (HVN) Detection: Automatically identifies and marks price levels with ≥80% of POC volume using yellow diamond markers - these act as magnetic support/resistance zones where institutions built positions
Low Volume Nodes (LVN) Detection: Marks thin volume areas with gray diamond markers - zones where price moves quickly with minimal friction, ideal for breakout targets
Adaptive Smart Pivots: ATR-based pivot detection that automatically adjusts length based on market volatility - catches more swings in low volatility, filters to major reversals in high volatility
Point of Control (POC) Line: Identifies the price level with maximum traded volume - the market's center of gravity. Line colors by delta: green when buyers dominated, red when sellers controlled the level
Value Area Lines: Dotted lines marking the 70% value area (configurable 50-98%) with delta-based coloring showing cumulative buyer/seller pressure within the range
Circle Pivot Markers: Clean visual markers at confirmed pivot points with translucent horizontal lines extending to current bar
Extend-Until-Touch: Pivot lines automatically retract when price touches them, keeping charts clean and showing active levels only
Dual Profile Modes: Left-side profile (default) or right-pinned bars ahead of price with fully customizable width and padding
Volume-Filtered Pivots: Only displays pivots with significant volume backing (≥20% of POC by default) - institutional turning points, not noise
HOW IT WORKS:
The indicator divides the lookback range (default 200 bars) into volume bins (default 50) and calculates total volume and delta (buying vs selling pressure) at each price level. Each bin is colored green if buyers dominated (close > open majority) or red if sellers controlled (close < open majority).
High Volume Nodes mark price levels where the most trading occurred - these become magnetic support/resistance zones. The Point of Control identifies the single price with maximum volume, acting as the market's gravitational center.
Smart Pivots use ATR to adapt to changing volatility, then filter against the volume profile. Only pivots with substantial volume backing are displayed, ensuring you see institutional turning points, not random noise.
RECOMMENDED SETTINGS:
Scalping (1-5 min): 100 lookback bars, 40 bins, 5-7 pivot length
Day Trading (15 min - 1 hour): 200 lookback bars, 50 bins, 10 pivot length (default)
Swing Trading (4 hour - Daily): 300-500 lookback bars, 60 bins, 15-20 pivot length
USAGE TIPS:
Enter long when price touches green HVN zones with adaptive pivot confirmation
Enter short when price reaches red HVN zones with pivot confirmation
Use POC as first target when entering below it, or as support backup when entering above
Watch for LVN zones as potential breakout acceleration areas
Combine green delta bins + HVN + pivot for highest-probability setups
WHAT MAKES THIS DIFFERENT:
Unlike traditional volume profiles, Volume Matrix Pro colors each bin individually by delta, giving granular insight into buyer/seller control at every price level. The adaptive pivot system adjusts automatically to volatility, while volume-filtering ensures only institutionally-backed turning points are displayed. High/Low Volume Node detection is fully automated with visual markers.
IMPORTANT NOTES:
This is a volume analysis tool - use with trend analysis and risk management
High Volume Nodes show where volume accumulated historically, not future support/resistance guarantees
Adaptive pivots adjust to volatility automatically but can still produce false signals in choppy markets
Best used as confirmation alongside price action, not as a standalone system
Profile recalculates on each bar to reflect current lookback range

ds-Volume with Flags & Alerts v1.2ds-Volume with Flags & Alerts: User & Training Guide
1. Summary of Features
This indicator is a powerful, all-in-one tool designed to give you a deep and customizable view of market volume. By analyzing volume in multiple ways, it helps you spot unusual activity, confirm trends, and identify potential reversals.
How It Helps a Trader:
Spotting Institutional Activity: The core purpose of the Volume Flags (using either the Multiplier or Standard Deviation method) is to highlight bars with exceptionally high volume. These spikes often signal the entry or exit of large institutional players. A high-volume up-bar can confirm bullish conviction, while a high-volume down-bar can signal significant selling pressure.
Identifying Climactic Events: The HVE (Highest Volume Ever) and HV1 (Highest Volume - 1 Year) labels automatically pinpoint the most significant volume events on the chart. A "blow-off top" at the end of a long uptrend or a "capitulation" event at a market bottom is almost always accompanied by an HVE or HV1 bar. These are critical moments to watch for potential trend reversals.
Gauging Buying vs. Selling Pressure: The Up/Down Volume Ratio gives you a more nuanced view than volume alone. A ratio consistently above 1.2 suggests that buyers are more aggressive, while a ratio below 0.8 suggests sellers are in control. Watching this ratio can help you confirm the strength of a trend or spot divergences where price is rising but the ratio is falling (a potential warning sign).
Visual Confirmation & Customization: With options to color both the volume bars and the main price bars, you can get instant visual confirmation of these events without having to look away from the price action. The ability to toggle features on and off keeps your chart clean and focused on what matters most to you.
Actionable Alerts: The comprehensive alert system ensures you don't miss a key event. You can be notified of everything from a new all-time high volume bar to a subtle shift in the Up/Down Volume Ratio, allowing you to react to market changes in real-time.
2. User-Changeable Options
This indicator is highly customizable. Here is a breakdown of every setting available in the "Inputs" tab.
General Settings
MA Length: The lookback period for the simple moving average (the gray area plot) of the volume.
Volume Flags
Color Price Bars with Flags: If checked, the main price bars on your chart will be colored when a high or low volume flag condition is met.
Color Volume Bars with Flags: If checked, the volume bars in the indicator pane will be colored for flag conditions.
Flag Calculation Method: This is a crucial setting.
Multiplier (Default): Identifies high volume based on a simple multiple of the average volume (e.g., volume is 1.4x its average). It's simple and intuitive.
Standard Deviation: Identifies high volume based on how statistically unusual it is compared to its recent behavior. This method is more adaptive to changing market volatility.
Daily/Weekly Lookback (Multiplier): Sets the lookback period for calculating the average volume when using the "Multiplier" method.
Daily/Weekly High-Vol Multiplier: Sets the multiplier for a high volume event (e.g., 1.4).
STDEV Length (Daily/Weekly): Sets the lookback period for calculating the average and standard deviation when using the "Standard Deviation" method.
STDEV Threshold (Daily/Weekly): Sets the number of standard deviations above the average required to trigger a high volume flag (e.g., 2.0).
Daily/Weekly Low-Vol Multiplier: Sets the threshold for a low volume event (e.g., 0.5 means volume is less than 50% of its average). This is always based on the multiplier method.
Ratios & Stats
Up/Down Ratio Daily/Weekly Lookback: Sets the lookback period for calculating the sum of up volume and down volume for the ratio.
Ratio Calculation Method:
Close vs. Open: Defines an "up volume" bar as one where the close is higher than the open.
Close vs. Previous Close (Default): Defines an "up volume" bar as one where the close is higher than the previous bar's close. This is a common standard.
Up Ratio Arrow Threshold: If the U/D Ratio exceeds this value, a green "up" arrow will appear.
Show Up Ratio Arrow: Toggles the visibility of the green "up" arrow.
Down Ratio Arrow Threshold: If the U/D Ratio falls below this value, a red "down" arrow will appear.
Show Down Ratio Arrow: Toggles the visibility of the red "down" arrow.

SuperTrend Confluence Signals [AlgoAlpha]OVERVIEW
This script enhances the classic SuperTrend indicator by integrating volume dynamics, retracement detection, and a multi-asset trend matrix—alongside an automatic mitigation-level drawing system. It's designed for traders who want to see not just trend direction, but the confluence of trend strength, volatility-adjusted retracements, and capital flow through volume pressure. It visually maps key transitions in market structure while offering a clean, color-coded overview of multiple symbols and timeframes in a single chart.
CONCEPTS
At the core is the traditional SuperTrend , which determines directional bias using Average True Range (ATR) with a volatility multiplier. This script overlays that with a dynamic volume histogram that scales relative to recent volume standard deviation, coloring volume bursts within the trend. Retracement signals are triggered when price pulls back toward the SuperTrend level but respects it—quantified through normalized distance sensitivity. On top of that, the indicator automatically draws and manages horizontal support/resistance zones that appear at key trend shifts. These levels persist and are cleared based on configurable rules such as wick/body sweeps or consecutive candle closes. A multi-asset, multi-timeframe table then gives an instant snapshot of trend status across five user-defined symbols and timeframes.
FEATURES
SuperTrend : Configurable ATR length and multiplier for flexible trend sensitivity.
Volumetric Histogram : Gradient-filled candles anchored to SuperTrend bands, scaled by relative volume to indicate activity intensity during trends.
Retracement Arrows : Signals printed when price nears the SuperTrend level without breaking it, allowing identification of high-probability continuation zones.
Volume TP Markers : Diamond markers flag high-volume events, contextualizing price moves with liquidity bursts.
Automatic Structure Levels : Draws clean horizontal lines at significant trend transitions, with optional volatility-based band fills. These levels self-update and clear based on price interaction logic.
Trend Table : Displays trend direction (▲/▼) across five assets and five timeframes. Each cell is colored according to trend bias, providing a compact overview for multi-market confluence.
USAGE
Start by loading the indicator on your main chart and adjusting the ATR Length and Multiplier to match your strategy timeframe. Use lower values for scalping and higher values for swing trading. The histogram bars will appear as colored candles above or below the SuperTrend level, indicating how strong volume is within that trend. Arrow signals suggest minor pullbacks within the trend, which can act as entry opportunities. The level system will automatically plot key price zones during trend flips; if "Body" is selected for mitigation, price must close through the level to invalidate it. If "Wick" is chosen, a single wick breach is enough. Adjust expiry and rejection settings to fine-tune how long levels stay on chart. Finally, enable the Multi-Asset Table to view live trend signals across popular symbols like AAPL or NVDA in different timeframes, helping spot macro-to-micro alignment for higher-confidence trades.

VR_BullriderVR Bullrider is indicator to help traders and investors to do volume price analysis.
Darker color green meaning volume is PADU
Light color green meaning volume is ok
Blue color = volume is not strong
X mark is to show volume is starting to moving up
Semoga manfaat semua, share share Volume Indicator ni supaya korang lebih mahir baca volume sebelum buat keputusan untuk entry sesuatu counter tu.

swing indicator Installation & Configuration - swing Indicator
⚙️ Parameter Configuration
"Settings" Group (General Parameters)
Show Moving Average: Show/hide the OI moving average
✅ Recommended: Enabled to visualize the trend
Helps identify if OI is above or below its average
MA Period: Moving average period (default: 20)
📊 Common values:
20: Short/medium term trend (responsive)
50: Medium term trend (balanced)
100: Long term trend (stable)
Compare with Volume: Display normalized volume in background
💡 Useful to compare OI evolution with volume
Helps identify divergences between Open interest (oi) and Volume
OI Significant Change Threshold: Detection threshold for significant changes
Available options: 10%, 15%, 20%, 25%, 30%, 40%
🎯 10-15%: High sensitivity (many signals, possible noise)
🎯 20-25%: Normal sensitivity (moderate signals, recommended)
🎯 30-40%: Low sensitivity (rare but very significant signals)
⚡ This threshold determines when green/red triangles appear
Manual OI Symbol (optional): Manually enter the OI symbol
📝 Leave empty for automatic detection
⚙️ Use only if your symbol is not automatically recognized
Manual example: COMEX:GC1!_OI for gold
"Visual Signals" Group
Show Triangles (Significant Changes): Show/hide triangles
▲ GREEN Triangle = Significant OI increase (> configured threshold)
▼ RED Triangle = Significant OI decrease (< -configured threshold)
✅ Recommended: Enabled to see important changes
💡 Disable if you find the chart too cluttered
Show Circles (MA Crossovers): Show/hide circles
● GREEN Circle = OI crosses MA upward
● RED Circle = OI crosses MA downward
✅ Recommended: Enabled if you use MA crossover strategy
💡 Disable if you focus only on OI variations
"Style" Group (Color Customization)
OI Color: Main Open Interest histogram color
Default: Blue
🎨 Customize according to your visual preferences
OI Rising: Histogram color when OI increases
Default: Transparent green
Subtle display of direction
OI Falling: Histogram color when OI decreases
Default: Transparent red
Subtle display of direction
MA Color: Moving average color
Default: Orange
Should contrast with OI color
Volume Color: Normalized volume background color
Default: Transparent gray
Discreet enough not to hinder reading
📊 Reading the Information Panel
The panel at the top right of the chart displays:
By: Alphaomega18
Indicator creator's signature
⚠️ WARNING: OI symbol not detected
Only appears if OI symbol is not automatically detected
Action: Check symbol or enter manually
Open Interest
Current Open Interest value
Format: number of contracts (e.g., 485.2K = 485,200 contracts)
Change
OI % change from previous bar
🟢 Green = OI increase
🔴 Red = OI decrease
Ex: +2.45% = OI increased by 2.45%
Threshold
Displays configured threshold for alerts
Ex: "25%" = alerts triggered at +25% or -25%
Yellow color for visibility
MA(20)
Current moving average value
Number in parentheses indicates period
Ex: MA(50) if you configured a 50 period
Signal
🟢 Strong Trend: OI > MA → Strong participation, solid trend
🔴 Weak Trend: OI < MA → Weak participation, fragile trend
🎯 Visual Signals on Chart
Triangles (Significant Changes)
▲ GREEN Triangle (bottom of chart)
Meaning: Significant OI increase
Trigger: OI increases more than configured threshold
Example: If threshold = 25%, triangle appears when OI +25% or more
📈 Interpretation: New contracts opened = growing interest
▼ RED Triangle (bottom of chart)
Meaning: Significant OI decrease
Trigger: OI decreases more than configured threshold
Example: If threshold = 25%, triangle appears when OI -25% or less
📉 Interpretation: Massive position closing = disengagement
Circles (Moving Average Crossovers)
🟢 GREEN Circle (bottom of chart)
Meaning: OI just crossed MA upward
Signal: Open interest back above its average
📊 Interpretation: Interest returning, potential trend start
🔴 RED Circle (top of chart)
Meaning: OI just crossed MA downward
Signal: Open interest back below its average
📊 Interpretation: Decreasing interest, potential weakening
🔔 Alert Configuration
Create an alert:
Right-click on chart → "Add Alert" (or ALT + A)
In "Condition", select "Open Interest"
Choose alert type from 4 available
Configure notification options
Click "Create"
Available alert types:
OI Significant Increase
Triggers when OI increases beyond configured threshold
Example: Threshold 25% → Alert if OI +25% or more
Use: Detect massive influx of new contracts
OI Significant Decrease
Triggers when OI decreases beyond configured threshold
Example: Threshold 25% → Alert if OI -25% or less
Use: Detect massive position closing
OI crosses MA up
Triggers when OI crosses its moving average upward
Condition: OI was below MA and crosses above
Use: Identify interest returning
OI crosses MA down
Triggers when OI crosses its moving average downward
Condition: OI was above MA and crosses below
Use: Identify decreasing interest
Notification configuration:
✉️ Email: Receive alert via email
📱 SMS: Receive alert via SMS (subscription required)
🔔 Popup: Notification on TradingView
📲 App: Notification on TradingView mobile app
🔗 Webhook: Send alert to external system
💡 Advanced Interpretation
Combined OI + Price Analysis:
Open InterestPriceInterpretationSuggested Action↑ Rising↑ Rising🟢 STRONG UptrendNew buyers entering, robust trend, consider long positions↑ Rising↓ Falling🔴 STRONG DowntrendNew sellers entering, bearish pressure, consider short positions↓ Falling↑ Rising📊 Short coveringClosing short positions, potentially temporary move↓ Falling↓ Falling📊 Long liquidationClosing long positions, potentially temporary move
OI vs Moving Average:
OI > MA (Signal: Strong Trend)
Open interest above its average
Market participation above normal
Trend supported by growing interest
✅ Increased confidence in market direction
OI < MA (Signal: Weak Trend)
Open interest below its average
Market participation below normal
Potentially fragile trend
⚠️ Caution: trend lacks conviction
OI vs Volume:
Rising OI + Rising Volume
New contracts + high trading activity
💪 Very strong trend signal
Falling OI + Rising Volume
Position closing + high activity
⚡ Potential reversal or massive profit-taking
Stable OI + Rising Volume
Transfer of positions between traders
🔄 Changing hands, no new commitments
🛠️ Troubleshooting
❌ Issue: "⚠️ WARNING - OI symbol not detected"
✅ Solutions:
Check contract symbol
Make sure you're on a continuous futures contract (e.g., GC1!, CL1!)
Not on a specific contract (e.g., GCZ2024)
Enter symbol manually
Go to Settings → Manual OI Symbol
Format: EXCHANGE:SYMBOL_OI
Examples:
Gold: COMEX:GC1!_OI
WTI Crude: NYMEX:CL1!_OI
Natural Gas: NYMEX:NG1!_OI
Check data availability
Not all markets have public OI data
Verify on TradingView if OI data exists
❌ Issue: No data displayed (empty chart)
✅ Solutions:
Change timeframe
OI is generally published daily
Switch to Daily (1D) or Weekly (1W)
Intraday timeframes may not have data
Check data connection
Refresh TradingView page
Check your TradingView subscription (some data requires subscription)
Test on another market
Try with gold (COMEX:GC1!) which always has OI data
If it works, problem comes from initial market
❌ Issue: Too many visual signals (cluttered chart)
✅ Solutions:
Increase detection threshold
Settings → OI Significant Change Threshold
Change from 20% to 30% or 40%
Fewer signals, but more significant
Disable some signals
Visual Signals → Uncheck "Show Triangles" or "Show Circles"
Keep only the most important signals for you
Adjust colors
Style → Reduce color opacity
Make signals more discreet visually
❌ Issue: Not enough signals
✅ Solutions:
Reduce detection threshold
Settings → OI Significant Change Threshold
Change to 10% or 15%
More signals, but beware of noise
Enable all signals
Visual Signals → Check "Show Triangles" AND "Show Circles"
Full display of all events
Reduce MA period
Settings → MA Period → Change from 20 to 10
More responsive MA = more crossovers
📈 Compatible Markets (Auto-detection)
✅ Energy (NYMEX)
CL, CL1!: WTI Crude Oil
BZ, BZ1!: Brent Crude
NG, NG1!: Natural Gas
RB, RB1!: RBOB Gasoline
HO, HO1!: Heating Oil
✅ Precious Metals (COMEX/NYMEX)
GC, GC1!: Gold
SI, SI1!: Silver
PL, PL1!: Platinum
PA, PA1!: Palladium
HG, HG1!: Copper
✅ Industrial Metals (LME)
ALI, ALI1!: Aluminum
ZNC, ZNC1!: Zinc
NI, NI1!: Nickel
✅ Agriculture - Grains (CBOT)
ZC, ZC1!: Corn
ZW, ZW1!: Wheat
ZS, ZS1!: Soybeans
ZM, ZM1!: Soybean Meal
ZL, ZL1!: Soybean Oil
ZO, ZO1!: Oats
ZR, ZR1!: Rice
✅ Agriculture - Softs (ICE)
SB, SB1!: Sugar
KC, KC1!: Coffee
CC, CC1!: Cocoa
CT, CT1!: Cotton
OJ, OJ1!: Orange Juice
✅ Livestock (CME)
LE, LE1!: Live Cattle
GF, GF1!: Feeder Cattle
HE, HE1!: Lean Hogs
✅ Other
LBS, LBS1!: Lumber (CME)
🎓 Usage Tips
For beginners:
Start with default parameters (threshold 25%, MA 20)
Enable all visual signals
Focus on liquid markets (gold, crude oil)
Observe how OI reacts to price movements
For intermediate traders:
Adjust threshold according to market volatility (15-30%)
Combine with other technical indicators
Create alerts for significant changes
Analyze OI/Price divergences
For advanced traders:
Use multiple MA periods (20, 50, 100)
Analyze OI/Volume/Price correlation
Configure alerts on multiple timeframes
Integrate into complete trading strategy
📊 Practical Example
Scenario: Gold Trading (COMEX:GC1!)
Initial setup:
Threshold: 20% (gold volatile)
MA: 20 days
All signals enabled
Timeframe: Daily (1D)
Observation:
Gold price: Uptrend
OI: ▲ Green triangle (increase of +22%)
Signal: 🟢 Strong Trend (OI > MA)
Interpretation:
New buyers massively entering
Uptrend supported by OI
Strong market conviction
Action:
✅ Long position validated by OI
Stop loss below technical support
Monitor if OI continues to increase
✨ Made by Alphaomega18

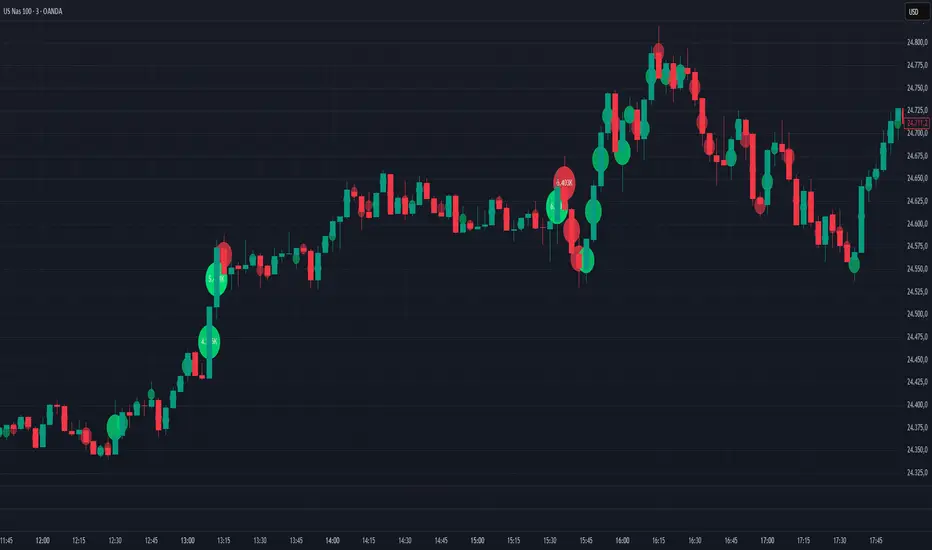
Volume Bubbles Delta Coloring Pro V1.0OVERVIEW
Bubbles Volume — Delta Pro extends the Classic concept with directional volume coloring and practical filters. It visualizes where volume concentrates inside each candle and which side (buyers or sellers) dominated. Ideal for intraday traders who want to see both intensity and direction of market activity.
HOW IT WORKS
Each bubble represents the candle’s volume normalized by volatility. Bubble size reflects relative volume; color reflects directional bias:
• Green = Buyer dominance (close > open)
• Red = Seller dominance (close < open)
• Yellow = Neutral (balanced candle)
A built-in delta proxy ((close – open) / range × volume) estimates directional strength — not true bid/ask delta, but a reliable approximation for chart volume.
FEATURES
• Delta coloring with adjustable Buy/Sell/Neutral colors
• Volume and delta thresholds to filter weak signals
• Session filter (e.g., 09:30–16:00) and lookback limit for speed
• Bubble position modes: HL2, Close, Body Mid, or High/Low by Delta
• Optional labels/lines for extreme volume
• Alerts for high-volume or strong delta spikes
USE CASES
Identify areas where aggressive buyers or sellers appeared, confirm breakouts with volume direction, or filter noise during low-activity periods. Combine with structure or VWAP for context.
NOTES
• Uses candle-based approximation, not orderflow.
• Visualization tool only; not a standalone signal.
• Original concept by BigBeluga, enhanced with delta logic and performance filters.
Licensed under CC BY-NC-SA 4.0.
Volume Profile Grid [Alpha Extract]A sophisticated volume distribution analysis system that transforms market activity into institutional-grade visual profiles, revealing hidden support/resistance zones and market participant behavior. Utilizing advanced price level segmentation, bullish/bearish volume separation, and dynamic range analysis, the Volume Profile Grid delivers comprehensive market structure insights with Point of Control (POC) identification, Value Area boundaries, and volume delta analysis. The system features intelligent visualization modes, real-time sentiment analysis, and flexible range selection to provide traders with clear, actionable volume-based market context.
🔶 Dynamic Range Analysis Engine
Implements dual-mode range selection with visible chart analysis and fixed period lookback, automatically adjusting to current market view or analyzing specified historical periods. The system intelligently calculates optimal bar counts while maintaining performance through configurable maximum limits, ensuring responsive profile generation across all timeframes with institutional-grade precision.
// Dynamic period calculation with intelligent caching
get_analysis_period() =>
if i_use_visible_range
chart_start_time = chart.left_visible_bar_time
current_time = last_bar_time
time_span = current_time - chart_start_time
tf_seconds = timeframe.in_seconds()
estimated_bars = time_span / (tf_seconds * 1000)
range_bars = math.floor(estimated_bars)
final_bars = math.min(range_bars, i_max_visible_bars)
math.max(final_bars, 50) // Minimum threshold
else
math.max(i_periods, 50)
🔶 Advanced Bull/Bear Volume Separation
Employs sophisticated candle classification algorithms to separate bullish and bearish volume at each price level, with weighted distribution based on bar intersection ratios. The system analyzes open/close relationships to determine volume direction, applying proportional allocation for doji patterns and ensuring accurate representation of buying versus selling pressure across the entire price spectrum.
🔶 Multi-Mode Volume Visualization
Features three distinct display modes for bull/bear volume representation: Split mode creates mirrored profiles from a central axis, Side by Side mode displays sequential bull/bear segments, and Stacked mode separates volumes vertically. Each mode offers unique insights into market participant behavior with customizable width, thickness, and color parameters for optimal visual clarity.
// Bull/Bear volume calculation with weighted distribution
for bar_offset = 0 to actual_periods - 1
bar_high = high
bar_low = low
bar_volume = volume
// Calculate intersection weight
weight = math.min(bar_high, next_level) - math.max(bar_low, current_level)
weight := weight / (bar_high - bar_low)
weighted_volume = bar_volume * weight
// Classify volume direction
if bar_close > bar_open
level_bull_volume += weighted_volume
else if bar_close < bar_open
level_bear_volume += weighted_volume
else // Doji handling
level_bull_volume += weighted_volume * 0.5
level_bear_volume += weighted_volume * 0.5
🔶 Point of Control & Value Area Detection
Implements institutional-standard POC identification by locating the price level with maximum volume accumulation, providing critical support/resistance zones. The Value Area calculation uses sophisticated sorting algorithms to identify the price range containing 70% of trading volume, revealing the market's accepted value zone where institutional participants concentrate their activity.
🔶 Volume Delta Analysis System
Incorporates real-time volume delta calculation with configurable dominance thresholds to identify significant bull/bear imbalances. The system visually highlights price levels where buying or selling pressure exceeds threshold percentages, providing immediate insight into directional volume flow and potential reversal zones through color-coded delta indicators.
// Value Area calculation using 70% volume accumulation
total_volume_sum = array.sum(total_volumes)
target_volume = total_volume_sum * 0.70
// Sort volumes to find highest activity zones
for i = 0 to array.size(sorted_volumes) - 2
for j = i + 1 to array.size(sorted_volumes) - 1
if array.get(sorted_volumes, j) > array.get(sorted_volumes, i)
// Swap and track indices for value area boundaries
// Accumulate until 70% threshold reached
for i = 0 to array.size(sorted_indices) - 1
accumulated_volume += vol
array.push(va_levels, array.get(volume_levels, idx))
if accumulated_volume >= target_volume
break
❓How It Works
🔶 Weighted Volume Distribution
Implements proportional volume allocation based on the percentage of each bar that intersects with price levels. When a bar spans multiple levels, volume is distributed proportionally based on the intersection ratio, ensuring precise representation of trading activity across the entire price spectrum without double-counting or volume loss.
🔶 Real-Time Profile Generation
Profiles regenerate on each bar close when in visible range mode, automatically adapting to chart zoom and scroll actions. The system maintains optimal performance through intelligent caching mechanisms and selective line updates, ensuring smooth operation even with maximum resolution settings and extended analysis periods.
🔶 Market Sentiment Analysis
Features comprehensive volume analysis table displaying total volume metrics, bullish/bearish percentages, and overall market sentiment classification. The system calculates volume dominance ratios in real-time, providing immediate insight into whether buyers or sellers control the current price structure with percentage-based sentiment thresholds.
🔶 Visual Profile Mapping
Provides multi-layered visual feedback through colored volume bars, POC line highlighting, Value Area boundaries, and optional delta indicators. The system supports profile mirroring for alternative perspectives, line extension for future reference, and customizable label positioning with detailed price information at critical levels.
Why Choose Volume Profile Grid
The Volume Profile Grid represents the evolution of volume analysis tools, combining traditional volume profile concepts with modern visualization techniques and intelligent analysis algorithms. By integrating dynamic range selection, sophisticated bull/bear separation, and multi-mode visualization with POC/Value Area detection, it provides traders with institutional-quality market structure analysis that adapts to any trading style. The comprehensive delta analysis and sentiment monitoring system eliminates guesswork while the flexible visualization options ensure optimal clarity across all market conditions, making it an essential tool for traders seeking to understand true market dynamics through volume-based price discovery.

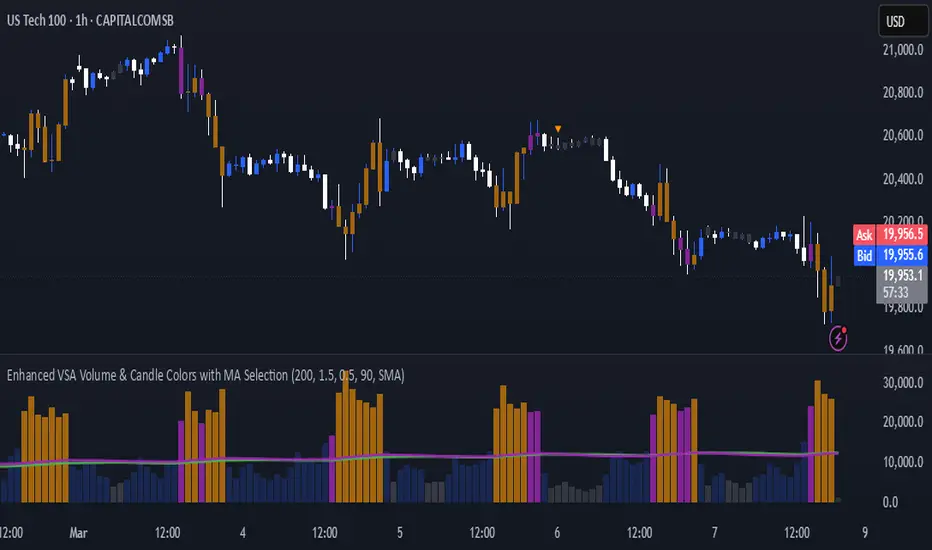
Enhanced VSA Volume & Candle Colors with MA SelectionOverview:
This script aims to enhance the visualization of volume spikes and price action by coloring volume bars and price candles dynamically based on the volume behavior. It allows traders to customize the type of volume moving average (SMA, EMA, or VWMA) used and apply various color schemes to highlight high, low, and extreme volume conditions. Additionally, alerts are generated when extreme or low-volume conditions occur.
---------------------------------------------------------------------------------------------------------------------
Key Features:
Customizable Volume Lookback Period:
The script allows users to define the period for calculating the moving average of volume (default: 200).
Volume Multiplier Settings:
High and low volume thresholds are defined using multipliers. Users can adjust these to customize how volume is categorized (default multipliers: 1.5 for high volume, 0.5 for low volume).
Percentile-Based Extreme Volume Detection:
The script calculates a percentile threshold for extreme volume (default: 90th percentile) based on the volume data, highlighting exceptionally high volume spikes.
Moving Average Selection:
Users can choose between Simple Moving Average (SMA), Exponential Moving Average (EMA), or Volume Weighted Moving Average (VWMA) to track volume trends over the selected lookback period.
Volume-Based Price Bar Coloring:
Price bars can be colored according to the volume conditions (high, low, or extreme). This feature can be toggled on or off.
Dynamic Transparency and Color Customization:
The script allows users to set custom colors for different volume conditions (high, low, neutral, extreme) and adjusts the transparency of volume bars based on the relative size of the volume.
Alerts:
Alerts can be set for when extreme volume spikes or low volume conditions are detected.
---------------------------------------------------------------------------------------------------------------------
Script Components:
Volume Histogram Plot:
Displays the volume bars with dynamic coloring based on the volume condition (high, low, or extreme). The color of the bars adjusts for clarity, with transparency based on volume levels.
Moving Average Plot:
Plots the selected volume moving average (SMA, EMA, or VWMA) to visualize the trend of volume over the chosen lookback period.
Smoothed Average Volume (EMA of Volume):
A smoothed EMA line is plotted to provide a clear representation of volume trends over time.
Price Bar Coloring:
If enabled, price bars are colored according to the current volume condition, providing immediate visual feedback to the trader.
---------------------------------------------------------------------------------------------------------------------
How It Can Be Used:
Volume Analysis for Entry/Exit Points: Traders can use the volume conditions (high, low, and extreme) to identify potential entry or exit points. High-volume bars often signal strong market activity, while low-volume bars may indicate consolidation or indecision.
Volume Confirmation for Trend Reversal: Extreme volume spikes can sometimes precede significant price movements. Traders can monitor these spikes for potential trend reversal signals.
Customizing Alerts: Alerts based on volume conditions help traders stay updated on important volume events without constantly monitoring the chart.
Color-Coded Price Action: The dynamic coloring of price bars makes it easier to identify periods of strong or weak market participation, allowing traders to make informed decisions quickly.
---------------------------------------------------------------------------------------------------------------------
Compliance with TradingView's House Rules:
No Promotion of Financial Products: The script does not promote any specific financial instruments or products, ensuring compliance with TradingView’s content guidelines.
Clear Functionality: The script provides clear, functional analysis tools without making unsupported claims about predicting market movements.
No Automated Trading: The script does not include any automated trading or order execution features, which complies with TradingView’s policy on non-automated scripts.
This breakdown ensures clarity on the script’s purpose, features, and how it might be used by traders. It's written in a way that fits TradingView's content guidelines, keeping the focus on providing valuable analytical tools rather than making promises or promoting any financial product.
[blackcat] L1 Stock Volume AnalyzerLevel: 1
Background
The basic volume analysis is that buyers are in control when the price is increased. The purchase volume takes place at the offer price and represents the lowest advertised price at which sellers sell their shares. When someone buys shares at the current asking price, it shows that someone wants the shares and is included in the purchase volume metric.
Function
L1 Stock Volume Analyzer plot colorful volume candles with different meanings: red for red price bars, green for green price bars, yellow for active buying volume, fuchsia for active selling volume, navy for high active buying volume turn over rate, and white for high active selling volume turn over rate.
Key Signal
VOLUME SIGNAL:
activbuying ---> active buying volume
activselling ---> active selling volume
abtor ---> high active buying turn over rate
astor ---> high active selling turn over rate
PRICE SIGNAL:
cd ---> price covergence and divergence
positioning ---> price positioning
callthshots ---> call the shorts price signal
Pros and Cons
Pros:
1. extract volume detailed information to judge price trend together
2. price convergence and divergence help to identify long and short entry points
Cons:
1. price convergence and divergence visually works well only for <= 8H time frame
2. this indicator only works for stock trading pairs
Remarks
In order to put price and volume in a unified scale, this indicator is scaled. This scaling is not suitable for all markets. At present, it has only been optimized in the stock exchange market.
Readme
In real life, I am a prolific inventor. I have successfully applied for more than 60 international and regional patents in the past 12 years. But in the past two years or so, I have tried to transfer my creativity to the development of trading strategies. Tradingview is the ideal platform for me. I am selecting and contributing some of the hundreds of scripts to publish in Tradingview community. Welcome everyone to interact with me to discuss these interesting pine scripts.
The scripts posted are categorized into 5 levels according to my efforts or manhours put into these works.
Level 1 : interesting script snippets or distinctive improvement from classic indicators or strategy. Level 1 scripts can usually appear in more complex indicators as a function module or element.
Level 2 : composite indicator/strategy. By selecting or combining several independent or dependent functions or sub indicators in proper way, the composite script exhibits a resonance phenomenon which can filter out noise or fake trading signal to enhance trading confidence level.
Level 3 : comprehensive indicator/strategy. They are simple trading systems based on my strategies. They are commonly containing several or all of entry signal, close signal, stop loss, take profit, re-entry, risk management, and position sizing techniques. Even some interesting fundamental and mass psychological aspects are incorporated.
Level 4 : script snippets or functions that do not disclose source code. Interesting element that can reveal market laws and work as raw material for indicators and strategies. If you find Level 1~2 scripts are helpful, Level 4 is a private version that took me far more efforts to develop.
Level 5 : indicator/strategy that do not disclose source code. private version of Level 3 script with my accumulated script processing skills or a large number of custom functions. I had a private function library built in past two years. Level 5 scripts use many of them to achieve private trading strategy.

[AKM] VolumeVolume breakout as entry indicator. This indicator will mark the candle as the volume spike/surge, indicate that institution/big player a.k.a jerung/shark make their entry on the market. Please use this indicator along with the AKM Setup4 indicator, as your entry will be depending on the divider line indicate in indicator AKM Setup4.
Rules:
1. Make sure which one are the latest candle volume breakout.
2. Make sure the 1-2-3 pattern has been formed.
3. Your entry position will be based on divider line in AKM Setup4 indicator. Buy entry if the volume breakout happen in Buy Zone or vice versa.
Background Color = Volume that lower than the value set in Low Volume will be in yellow color. Green color will be indicate if close > open and volume bigger than Low Volume. Red color for open > close and volume bigger than Low Volume.
Volume Surge = This will mark a boundary if volume bigger than the value set in Low Volume until the new surge detected.
Average Volume = This will mark a boundary if volume bigger than the value set in Average Volume Candle Bar until the new surge detected.
Remarks : Default value is for Future Crude Palm Oil (FCPO) in 3 minutes timeframe.
Send us private message on TV to gain access to the indicator.

Volume Candle Color (Continuous)Volume-Based Candle Color Indicator (Continuous Gradient)
Overview
Transform your charts with this advanced volume visualization tool that colors candles based on relative volume intensity using a smooth, continuous gradient . Unlike traditional step-based volume indicators, this script provides nuanced color transitions that make volume anomalies instantly visible.
Key Features
Continuous Color Gradient
Smooth transitions - No more discrete color steps
High volume = Bright, opaque colors that demand attention
Low volume = Faded, transparent colors that blend into background
Real-time adaptation to market conditions
Full Customization Control
Volume Range Settings: Define min/max volume ratios for optimal sensitivity
Transparency Control: Adjust brightness levels from 0-95%
Custom Colors: Choose your preferred bullish/bearish base colors
Moving Average Period: Customize the volume comparison timeframe (default: 30)
Enhanced Visualization
Optional Info Panel: Real-time display of volume metrics
Volume Ratio Plot: Additional pane showing volume ratio trends
Clean Interface: Non-intrusive overlay that enhances price action
How It Works
The indicator calculates relative volume by comparing current volume to a Simple Moving Average (SMA) of volume over your chosen period. This ratio is then mapped to a continuous color scale:
Volume Ratio > 2.0: Maximum intensity (brightest colors)
Volume Ratio 1.0: Average volume (medium intensity)
Volume Ratio < 0.5: Below average (most transparent)
Bullish Candles (Close > Open): Green gradient
Bearish Candles (Close < Open): Red gradient
Trading Applications
Volume Spread Analysis (VSA)
Perfect companion for VSA traders who need to quickly identify:
Climactic volume at key support/resistance levels
No demand situations with low volume
Professional money accumulation/distribution patterns
Breakout Confirmation
High volume breakouts: Immediately visible with bright colors
False breakouts: Revealed by low volume (faded colors)
Volume divergences: Spotted instantly through color intensity changes
Market Structure Analysis
Support/Resistance tests: Volume validation through color brightness
Trend strength: Continuous color feedback on volume participation
Market phases: Easy identification of accumulation vs distribution
Why Choose This Indicator?
Advantages Over Traditional Volume Indicators:
Instant Visual Feedback: No need to look at separate volume bars
Continuous Scale: More precise than discrete level systems
Customizable Sensitivity: Adapt to any market or timeframe
Clean Charts: Maintains focus on price action while adding volume context
Universal Application: Works on all instruments and timeframes
Settings Guide
Essential Settings:
Volume MA Period (30): Longer periods = smoother baseline, shorter = more sensitive
Min Volume Ratio (0.2): Lower values = more sensitivity to low volume
Max Volume Ratio (3.0): Higher values = accommodate extreme volume spikes
Transparency Range (10-85%): Adjust visual contrast to your preference
Pro Tips:
Day Trading: Use 10-20 period MA for quick volume changes
Swing Trading: Use 30-50 period MA for broader volume context
Lower transparency range (0-70%) for subtle effects
Higher transparency range (20-90%) for dramatic contrasts
Best Practices
Combine with Price Action: Use volume colors to confirm price patterns
Multiple Timeframes: Apply on different timeframes for comprehensive analysis
Market Context: Adjust sensitivity based on market volatility periods
Backtesting: Test settings on historical data before live trading
Perfect For:
Volume Spread Analysis practitioners
Breakout traders seeking confirmation
Market structure analysts
Anyone wanting cleaner, more intuitive volume visualization
Technical Specifications
Pine Script v6 - Latest version compatibility
Overlay Indicator - Works directly on price charts
Minimal Performance Impact - Optimized calculations
All Market Types - Stocks, Forex, Crypto, Futures
Transform your volume analysis today! Experience the difference continuous color gradients make in identifying high-probability trading opportunities.
Like and follow for more innovative trading tools!
IDX - 5UPThe UDX-5UP is a custom indicator designed to assist traders in identifying trends, entry and exit signals, and market reversal moments with greater accuracy. It combines price analysis, volume, and momentum (RSI) to provide clear buy ("Buy") and sell ("Sell") signals across any asset and timeframe, whether you're a scalper on the 5M chart or a swing trader on the 4H chart. Inspired by robust technical analysis strategies, the UDX-5UP is ideal for traders seeking a reliable tool to operate in volatile markets such as cryptocurrencies, forex, stocks, and futures.
Components of the UDX-5UP
The UDX-5UP consists of three main panels that work together to provide a comprehensive view of the market:
Main Panel (Price):
Pivot Supertrend: A dynamic line that changes color to indicate the trend. Green for an uptrend (look for buys), red for a downtrend (look for sells).
SMAs (Simple Moving Averages): Two SMAs (8 and 21 periods) to confirm the trend direction. When the SMA 8 crosses above the SMA 21, it’s a bullish signal; when it crosses below, it’s a bearish signal.
Entry/Exit Signals: "Buy" (green) and "Sell" (red) labels are plotted on the chart when entry or exit conditions are met.
Volume Panel:
Colored Volume Bars: Green bars indicate dominant buying volume, while red bars indicate dominant selling volume.
Volume Moving Average (MA 20): A blue line that helps identify whether the current volume is above or below the average, confirming the strength of the movement.
RSI Panel:
RSI (Relative Strength Index): Calculated with a period of 14, with overbought (70) and oversold (30) lines to identify momentum extremes.
Divergences: The indicator detects divergences between the RSI and price, plotting signals for potential reversals.
How the UDX-5UP Works
The UDX-5UP uses a combination of rules to generate buy and sell signals:
Buy Signal ("Buy"):
The Pivot Supertrend changes from red to green.
The SMA 8 crosses above the SMA 21.
The volume is above the MA 20, with green bars (indicating buying pressure).
The RSI is rising and, ideally, below 70 (not overbought).
Example: On the 4H chart, the price of Tether (USDT) is at 0.05515. The Pivot Supertrend turns green, the SMA 8 crosses above the SMA 21, the volume shows green bars above the MA 20, and the RSI is at 46. The UDX-5UP plots a "Buy".
Sell Signal ("Sell"):
The Pivot Supertrend changes from green to red.
The SMA 8 crosses below the SMA 21.
The volume is above the MA 20, with red bars (indicating selling pressure).
The RSI is falling and, ideally, above 70 (overbought).
Example: On the 4H chart, the price of Tether rises to 0.05817. The Pivot Supertrend turns red, the SMA 8 crosses below the SMA 21, the volume shows red bars, and the RSI is above 70. The UDX-5UP plots a "Sell".
RSI Divergences:
The indicator identifies bullish divergences (price makes a lower low, but RSI makes a higher low) and bearish divergences (price makes a higher high, but RSI makes a lower high), plotting alerts for potential reversals.
Adjustable Settings
The UDX-5UP is highly customizable to suit your trading style:
Pivot Supertrend Period: Default is 2. Increase to 3 or 4 for more conservative signals (fewer false positives, but more lag).
SMA Periods: Default is 8 and 21. Adjust to 5 and 13 for smaller timeframes (e.g., 5M) or 13 and 34 for larger timeframes (e.g., 1D).
RSI Period: Default is 14. Reduce to 10 for greater sensitivity or increase to 20 for smoother signals.
Overbought/Oversold Levels: Default is 70/30. Adjust to 80/20 in volatile markets.
Display Panels: You can enable/disable the volume and RSI panels to simplify the chart.
How to Use the UDX-5UP
Identify the Trend:
Use the Pivot Supertrend and SMAs to determine the market direction. Uptrend: look for buys. Downtrend: look for sells.
Confirm with Volume and RSI:
For buys: Volume above the MA 20 with green bars, RSI rising and below 70.
For sells: Volume above the MA 20 with red bars, RSI falling and above 70.
Enter the Trade:
Enter a buy when the UDX-5UP plots a "Buy" and all conditions are aligned.
Enter a sell when the UDX-5UP plots a "Sell" and all conditions are aligned.
Plan the Exit:
Use Fibonacci levels or support/resistance on the price chart to set targets.
Exit the trade when the UDX-5UP plots an opposite signal ("Sell" after a buy, "Buy" after a sell).
Tips for Beginners
Start with Larger Timeframes: Use the 4H or 1D chart for more reliable signals and less noise.
Combine with Other Indicators: Use the UDX-5UP with tools like Fibonacci or the Candles RSI (another powerful indicator) to confirm signals.
Practice in Demo Mode: Test the indicator in a demo account before using real money.
Manage Risk: Always use a stop-loss and don’t risk more than 1-2% of your capital per trade.
Why Use the UDX-5UP?
Simplicity: Clear "Buy" and "Sell" signals make trading accessible even for beginners.
Versatility: Works on any asset (crypto, forex, stocks) and timeframe.
Multiple Confirmations: Combines price, volume, and momentum to reduce false signals.
Customizable: Adjust the settings to match your trading style.
Author’s Notes
The UDX-5UP was developed based on years of trading and technical analysis experience. It is an evolution of tested strategies, designed to help traders navigate volatile markets with confidence. However, no indicator is infallible. Always combine the UDX-5UP with proper risk management and fundamental analysis, especially in unpredictable markets. Feedback is welcome – leave a comment or reach out with suggestions for improvements!

Heatmap Volume# Heatmap Volume (HeatVol) Indicator
A sophisticated volume analysis tool that visualizes trading volume intensity through a dynamic heatmap system. This indicator helps traders identify significant volume patterns and potential market turning points by comparing current volume to historical averages.
## Key Features
1. **Dynamic Volume Analysis**
- Moving average based volume comparison
- Standard deviation based threshold calculation
- Multiple volume intensity levels (Extra High, High, Medium, Normal, Low)
- Customizable lookback periods for both MA and Standard Deviation
2. **Visual Representation**
- Heatmap color coding for volume intensity
- Optional colored volume bars
- Multiple display modes (Lines, Backgrounds, Both, None)
- Two color schemes (Heatmap or Up/Down)
3. **Flexible Configuration**
- Adjustable threshold multipliers for each intensity level
- Customizable colors for all volume levels
- Separate color settings for bullish and bearish volumes
- Transparent overlays for clear price action visibility
4. **Alert System**
- Volume threshold breach notifications
- Direction-specific alerts (Up/Down)
- Multiple alert conditions for different volume levels
## Trading Applications
1. **Volume Analysis**
- Identify unusual volume spikes
- Detect volume divergences
- Monitor volume trend changes
- Spot potential accumulation/distribution
2. **Market Psychology**
- Gauge market participation levels
- Identify potential exhaustion points
- Confirm price movements with volume
3. **Trade Validation**
- Confirm breakouts with volume
- Validate trend strength
- Identify potential false moves
## Setup Guide
1. **Period Settings**
- Adjust MA length (default: 610) based on your timeframe
- Set Standard Deviation period for volatility sensitivity
- Fine-tune threshold multipliers for market conditions
2. **Visual Configuration**
- Choose between Heatmap or Up/Down color modes
- Select display style (Lines, Backgrounds, Both)
- Customize colors for different volume levels
## Best Practices
1. Use longer periods for trend analysis, shorter for day trading
2. Combine with price action for better trade decisions
3. Pay attention to color transitions for volume trend changes
4. Use alerts to catch significant volume events
## Notes
1. Higher threshold multipliers mean more selective volume signals
2. Color intensity reflects volume significance
3. Background mode provides better overall volume trend visibility
4. Line mode helps identify specific volume thresholds
This indicator is particularly useful for traders who rely on volume analysis for their trading decisions. It provides a clear visual representation of volume intensity and helps identify potentially significant market moves through volume analysis.
VSA - The Volume HUDVSA Volume HUD: Your At-a-Glance Volume Dashboard
Tired of cluttered charts with multiple indicators taking up screen space?
The VSA Volume HUD is a clean, powerful, and fully customisable Heads-Up Display that puts all the critical volume and price action data you need into one compact box, right on your chart.
Designed for traders who rely on Volume Spread Analysis (VSA), this tool helps you instantly gauge the strength, conviction, and context behind every price move as it happens.
Key Features
This indicator isn't just about showing the current volume; it provides a comprehensive, real-time analysis of the market's activity.
Real-time VSA Dashboard: A persistent on-screen table that updates with every tick, giving you instant feedback without needing to look away from the price. The HUD is fully draggable (hold Ctrl/Cmd + click and drag) to place it anywhere you like.
Essential Volume Metrics:
Current Volume: Displayed in a clean, abbreviated format (e.g., 1.25M for millions, 54.3K for thousands).
% Change (vs. Previous Bar): Instantly see if volume is expanding or contracting.
Vs Short-Term Average: Compare the current bar's volume to a moving average to spot unusual spikes.
Volume Velocity: Measures the rate of change in volume over a short period, helping you spot acceleration or deceleration in market interest.
Relative Volume (RVOL): See how the current volume compares to the average for that specific time of day, perfect for identifying abnormally high or low activity.
Price Action & Volatility Context:
Range vs. ATR: Quickly determine if the current bar's volatility is expanding or contracting compared to the recent average.
Price vs. VWAP: See how far the current price has deviated from the session's Volume-Weighted Average Price, a key level for institutional traders.
Deep Customization is Key
Tailor the HUD to perfectly match your trading style and chart aesthetic.
Display & Layout:
Compact Mode: Remove the metric labels for a sleek, minimalist view that saves screen space.
Bar Meters: Enable optional visual bars next to key metrics for a quick, graphical representation of strength.
Total Control: Toggle every single metric on or off to build the exact dashboard you need. Adjust text size, position, and background opacity with ease.
Smart Coloring & Visual Alerts:
Advanced VSA Coloring: This isn't just about up/down candles. The script intelligently colors volume based on confluence. It highlights increasing volume on a strong up-bar (bullish confirmation) or increasing volume on a down-bar (potential climax or distribution), giving you a deeper VSA context.
High Volume Highlight: Make standout bars impossible to miss! The entire HUD background can change color automatically when volume surges past a custom threshold (e.g., over 150% of the average), instantly drawing your attention to critical moments.
Full Color Customization: Change every color to match your chart's theme, including separate colors for bullish/bearish moves, the background, and the border.
How to Use It
The VSA Volume HUD is a powerful confirmation tool. Use it to:
Confirm Breakouts: Look for a spike in Volume vs. Average and RVOL as price breaks a key level.
Spot Exhaustion: Notice high volume on a narrow-range candle after a long trend, visible through the Range/ATR metric.
Gauge Conviction: Use the Advanced Coloring to see if volume is supporting the price move (e.g., green volume on a green candle) or diverging from it.

Volume & ATR Projection Tracker w/ Table & Alerts# README: Volume & ATR Projection Tracker (Pine Script Indicator)
## Overview
This Pine Script indicator for TradingView is designed to help traders analyze volume activity and potential short-term price volatility. It plots volume bars, calculates a moving average of volume, highlights unusual volume spikes (differentiating between up and down bars), and projects potential price ranges for upcoming hours based on Average True Range (ATR). It also provides a status table and configurable alerts.
**Disclaimer:** This indicator provides informational analysis and projections based on historical data and volatility. It does **not** provide guaranteed price predictions or financial advice. Trading involves substantial risk. Always do your own research and consult with a qualified financial advisor.
## Features
* **Volume Plotting:** Displays volume as a histogram in a separate panel.
* **Volume Moving Average:** Calculates and plots a configurable MA (SMA, EMA, WMA) of volume.
* **Unusual Volume Detection:** Identifies bars where volume significantly exceeds its moving average (based on a user-defined multiplier).
* **Differentiated Volume Analysis:**
* Colors volume bars differently based on whether unusual volume occurred on an up-bar (Close > Open), down-bar (Close < Open), or neutral bar (Close == Open).
* Plots different spike markers (up/down triangles) on the price chart for unusual volume on up/down bars.
* **ATR Volatility Projections:**
* Calculates the Average True Range (ATR) as a measure of recent volatility.
* Projects a potential price range (Close +/- ATR \* Multiplier) for a specified number of future hours.
* Plots these ranges as dashed lines and labels on the price chart.
* **Important:** These are volatility-based *ranges*, not directional predictions.
* **Status Table:** Displays a concise summary table on the chart including:
* Current Volume Status (Normal, High (Up), High (Down), High (Neut)).
* Current Volume compared to its MA (as a percentage).
* The projected ATR range for the next hour.
* **Configurable Alerts:** Provides alert conditions for:
* Unusual Volume detection.
* Volume crossing above its MA.
* Volume crossing below its MA.
* **Customizable Inputs:** Allows users to configure MA settings, volume threshold, ATR settings, projection hours, trading session times, and colors.
## How it Works
1. **Volume Analysis:**
* Calculates a Moving Average (SMA, EMA, or WMA) of the volume over a specified length (`MA Length`).
* Compares the current bar's volume to this MA. If `Volume > MA * Unusual Vol Multiplier`, the volume is flagged as "unusual".
* Checks if the unusual volume occurred on a bar where `Close > Open` (Up), `Close < Open` (Down), or `Close == Open` (Neutral).
* Colors the volume bars and plots spike markers based on this differentiated status.
2. **ATR Projections:**
* Calculates the ATR over a specified length (`ATR Length`).
* At the start of each hour *within the defined Trading Session*:
* Calculates an upper projection level: `Current Close + (Current ATR * ATR Multiplier)`.
* Calculates a lower projection level: `Current Close - (Current ATR * ATR Multiplier)`.
* Stores these levels for the specified number of `Projection Hours Ahead`.
* Draws dashed lines and labels on the price chart representing these hourly ranges for the future, but only if they are within TradingView's 500-bar drawing limit from the current bar.
3. **Status Table:**
* Updates on the last bar of the chart.
* Displays the current differentiated volume status, the percentage difference between current volume and its MA, and the calculated ATR range for the *next* hour.
4. **Alerts:**
* Uses `alertcondition()` to create trigger conditions based on `unusualVolumeBase`, `vol_cross_above`, and `vol_cross_below`. Users can create alerts based on these conditions in the TradingView UI.
## Input Settings
The indicator settings are organized into groups:
**Group 1: Volume Analysis Settings**
* **MA Length:** (Default: 20) Number of bars for the volume MA calculation.
* **MA Type:** (Default: SMA) Type of moving average (SMA, EMA, WMA).
* **Unusual Vol Multiplier:** (Default: 2.0) Threshold for detecting unusual volume (Volume > MA * Multiplier).
* **Show Volume Spikes:** (Default: true) Toggle visibility of triangle markers on the price chart.
* **Show Volume MA:** (Default: true) Toggle visibility of the MA line on the volume panel.
**Group 2: ATR Projection Settings**
* **ATR Length:** (Default: 14) Number of bars for the ATR calculation.
* **ATR Multiplier:** (Default: 1.5) Factor applied to ATR to determine the projection range width. Higher values create wider ranges.
* **Projection Hours Ahead:** (Default: 8) How many hours forward to calculate and display projections.
* **Show Projections:** (Default: true) Toggle visibility of projection lines and labels on the price chart.
**Group 3: Session & Colors**
* **Trading Session:** (Default: "0930-1600") Defines the hours during which projections are calculated. **Crucial:** Format is HHMM-HHMM based on the exchange timezone (see Timezone Note below).
* **Normal Vol Color:** (Default: blue) Color for volume bars when volume is not unusual.
* **Volume MA Color:** (Default: yellow) Color of the volume MA line.
* **Unusual Vol (Up Bar) Color:** (Default: light green) Color for unusual volume bars where Close > Open.
* **Unusual Vol (Down Bar) Color:** (Default: light red) Color for unusual volume bars where Close < Open.
* **Unusual Vol (Neutral Bar) Color:** (Default: light gray) Color for unusual volume bars where Close == Open.
* **Projection Line Color:** (Default: orange) Color of the dashed projection range lines.
* **Proj Label Bg Color:** (Default: semi-transparent gray) Background color for projection labels.
* **Proj Label Text Color:** (Default: white) Text color for projection labels.
## Timezone Note
The `Trading Session` input relies on a timezone setting within the `is_in_session` function in the code (currently hardcoded to `"UTC-4"` as an example for US Eastern Time). **You may need to edit the script code** to change this timezone string (e.g., `"America/New_York"`, `"Europe/London"`, `"Asia/Tokyo"`) to match the exchange time of the instrument you are trading. Consult Pine Script documentation for valid timezone strings.
## Limitations
* **Drawing Limit:** TradingView limits drawing objects (lines, labels) to a maximum of ~500 bars into the future from the current bar. On lower timeframes, the script automatically stops drawing projections that exceed this limit.
* **Projection vs. Prediction:** The ATR ranges are based on past volatility and are *not* price predictions. The market can easily move outside these projected ranges.
* **Alerts:** Alerts for price crossing the projected future levels are not implemented due to technical complexity in Pine Script.
## Disclaimer
Trading financial markets involves substantial risk of loss and is not suitable for all investors. The information provided by this indicator is for educational and informational purposes only and does not constitute financial advice, investment advice, trading advice, or any other sort of advice. You should not make any investment decision based solely on the information provided by this indicator. Past performance is not indicative of future results.
CAT Volume AccumulationThis indicator colors volume bars depending on change in price and volume. It helps traders to identify volume accumulation patterns.
The main interest for us is clusters of the blue bars and large green bars.
The blue volume bars are up days with unusually high trading volume .
Green bars are up days with normal trading volume .
Red bars are down days with elevated trading volume . It is not advisable to buy a stock on a day like that.
It makes sense to wait until a red down down is followed by a gray day, when price stop making lower low and trading volume dries down. That is a signal that bears lost momentum.
If we see a cluster of several blue bars that tells us there are institutional buyers building a position out there.
If we get a pullback that follows that volume accumulation pattern represented by several blue and large green bars that increases our chances for continuation of the move higher after a pullback.
[blackcat] L4 Better Stephen Klinger KVOLevel: 4
Background
The Klinger Volume Oscillator (KVO) is a trading indicator that uses both price and volume to identify potential longer-term trend reversal points in the markets. Introduced to the trading community by Stephen Klinger, this indicator measures the trend of cash flow based on volume and price movements. In this version, I enhanced it with better volume indicator colorful bars and better trading strategy to have entries and exits, which can be called as Better Klinger Volume Oscillator (BKVO)
Function
Although it is designed to measure the longer-term cash flow trend, it can also exhibit short-term fluctuations. This may sound confusing, but a simple version of the Klinger calculation can be better explained as follows:
The volume moves through the market in each period
Price movements, no matter how small they are taken into account
The Klinger oscillator uses the lowest, highest, and closing prices
The calculation is based on price and volume and is called volume force (VF).
We then get an oscillator derived from the VF Slow 55 EMA and Fast 34 EMA (plus a 13 EMA signal line).
There are four main ways traders use the BKVO to trade in the markets:
Trend direction
Buy and sell trading signals
Bullish and bearish divergence
Colorful volume bars to indicate trend status
Trend direction
When using the Klinger oscillator for trend, there are two ways to do it. The first method is to wait for the KVO indicator line, not the signal line, to cross the zero line.
Traders can also use an intersection of the signal line with the KVO line as a directional sign. It's a little more aggressive.
Traders would only consider long or short trades depending on the KVO line relationship with the zero line. Aggressive traders can buy or sell when the trend changes, keeping their strategy objective.
Buy and sell trading signals
When we use the actual trading signal indicator we are using the signal line the same way we would trade the moving average convergence divergence (MACD) crosses. If you traded every crossover, you can see that you are in draw down and caught in whipsaw. This is not the way to use the original version of KVO as a strategy. Due to original version may produce too many fake crosses. I prefer to use volume bars to display the trends with proper entry and exit alerts. However, it could be better if you can use your own experience and skills to utilize this indicator subjectively besides inherent alerts provided.
Klinger Divergence Trading
Divergence is essentially technical indicators showing one direction and price doing another. If you see the price chart heading upwards while the Klinger indicator has crossed the signal line and heading towards zero. This would be bearish divergence. Bullish divergence is the opposite. I designed divergence indicator inside. However, they are turned off in default and you have to turn them on by yourself if you think they are helpful.
Colorful volume bars
Volume has to be the most underrated market variable used in technical analysis. But if you know how to analyze and interpret them, you can watch market turning points develop and anticipate setbacks and trend changes. You can find out if the pros are buying or selling by analyzing:
Transaction volume at the bid or ask price
High to lower area of the bar and
Average trade size.
The colorful volume bars improves your typical volume histogram by coloring the bars based on 5 criteria:
Volume Climax Up - high volume, high range, up bar (red)
Volume Climax Down - high volume, high range, down bar (white)
High Volume Churn - bars with high volume and low range (green)
Low Volume - bar for low volume (yellow)
Volume Climax plus High Volume Churn - both of the above conditions (fuchsia)
When there are no volume signals, the default color of the histogram bar is cyan/aqua.
Key Signal
KVO Volume Climax up/ Peak Up (Red Bar)
Volume Climax Up bars are identified by multiplying the buy volume (traded on ask) by the range and then looking for the highest value in the last 8 bars (default setting). Volume Climax Up bars indicate a large volume demand leading to rising prices. By default, the bars are colored red.
Volume climax up bars are typically displayed when:
The starting signal for upward trends
The end of the uptrends and Pullbacks during downtrends.
The beginning of an uptrend is almost always marked by a Volume Climax Up bar.
This shows that buyers like to get in and bring large quantities to market and raise prices quickly. A valid breakout should be followed by further buying, but occasionally it will test the low of the volume climax up bar.
Market highs are also indicated by Volume Climax Up bars, often with high volume and / or low volume test patterns. Trend changes usually take a while to develop, so don't get pulled into it too soon - wait for the market to run out. One useful signal to look out for is the low volume bar - this shows that there is finally no demand and the market is likely to stop moving.
During a downtrend, pullbacks are often indicated by Volume Climax Up bars. These show short covers or traders calling a bottom too quickly. As soon as this Climax volume decreases, the downward trend is likely to continue. The continuation of the downtrend is confirmed when the low of the Volume Climax Up bar is taken out.
KVO volume Climax Down/ Peak Down (White Bar)
Volume Climax Down bars are essentially the opposite of Volume Climax Up bars.
Volume Climax Down bars are identified by multiplying the sales volume (traded at bid) by the range and then finding the highest value in the last 8 bars (default). Volume Climax Down bars indicate a large supply that is pushing prices down. The default setting is the white color of the bars.
Volume climax down bars are usually displayed when:
The beginning of the down trends
The end of the down trends and Pullbacks on uptrends.
The beginning of a downtrend is almost always marked by a Volume Climax Down bar.
This shows that the sellers are happy to join in and that large quantities come onto the market and that prices are quickly depressed. A valid breakdown should be followed by more sales, but occasionally the high of the Volume Climax Down bar is tested.
Market lows are also indicated by Volume Climax Down bars, often with low volume churn and / or test patterns. Trend changes usually take a while to develop, so don't get pulled into it too soon - wait for the market to run out. One useful signal to look out for is the low volume bar - it shows that there is finally no supply and the market is likely to stop falling.
During an uptrend, pullbacks are often indicated by Volume Climax Down bars. These show profit taking or traders calling a top too quickly. As soon as this Climax volume drops, the uptrend will likely resume. The continuation of the uptrend will be confirmed when the high of the Volume Climax Down bar is removed.
KVO High volume churn (Green Bars)
High volume churn bars are identified by dividing the volume by the high to low range of the bar and then looking for the highest value in the last 8 bars (default). High volume churn bars indicate profit taking, new supply at the top, or new demand at the bottom of the market. The standard setting is that the bars of the volume histogram are colored green.
High volume churn bars are typically seen at:
The end of the uptrends
The end of the down trends and Mid-trend profit-taking.
When volume churn is high, it means that demand is being met by new supply on top or supply is being met by new demand on the bottom - the price cannot actually go up when new supply or demand comes into the market. Hence the bar is low from top to bottom.
Occasionally Volume Climax (up or down) and High Volume Churn bars coincide and these bars are magenta in color. Beware of intra-day charts. The high volume churn often occurs on the last bars of the trading day. This does not necessarily represent a possible turning point, but a high volume of day traders closing positions.
KVO Low Volume (Yellow Bar)
Low volume bars are identified by looking for the lowest volume in the last 8 bars (default). Low volume bars indicate a lack of demand at the highs or a lack of supply at the lows. The default setting is to color the bars yellow.
Low volume bars are usually displayed when:
The end of the uptrends
The end of the down trends and Pullbacks right in the middle of the trend.
Low volume bars are important volume indicator signal for trend reversal. They are very useful for confirming indicators of a change in trend direction when the market is testing a high or a low.
KVO High Volume Churn + Climax (Fuchsia Bar)
This is a mixture of KVO High volume churn (Green Bars) and KVO Volume Climax up/ Peak Up (Red Bar) or KVO volume Climax Down/ Peak Down (White Bar).
KVO No Volume Signal (Cyan/Aqua Bar)
There is no volume featured signal produced by the indicator.
Remarks
This is a Level 4 invite-only and closed source indicator.
Redeem rule: constant 350 tradingview coins per month and 350X10 tradingview coins per year.
